
In mathematics, we have to handle large data sets. We use the central tendency to get valuable information from these large data sets. The measures of central tendency provide us statistical information about these data sets. Mean, median, mode, and range are the four primary measures of central tendency. These four measures of central tendency provide us useful information about large data sets. After combining this information, we can easily get an idea about the connection of these data sets. Here, we have provided a brief explanation about mean, median, mode, and range calculators.
What Is Mean?
Mean is the average value of the given set of data. If you have a discrete set of numbers, its central value is the mean. We use ‘X̄’ to denote the mean of the data. If you have X1, X2, …, Xn numbers, you can use the following formula to calculate the mean.
X̄ = X1+X2+…+Xn/n
X̄ = ΣX/n
Steps to Calculate the Mean
To calculate the mean of a discrete set of numbers, you will have to follow some essential steps.
i. First of all, you should determine the numbers of the set. These numbers should consist of real numbers only.
It means that these numbers should not be variables. You should also try to arrange these numbers in ascending order.
ii. Secondly, you should add these numbers to find the sum. For this reason, you can use a calculator or you can also add these numbers by hand.
iii. Thirdly, you should count all the values. If a specific value is repeated in your set, you should count each value to get the total.
iv. At last, you will have to divide the sum of the values by the total number of values. In this way, you will get the mean of the set of discrete numbers.
Relevant Posts:
BODMAS Rule
Difference Between Rational And Irrational Numbers
Types of Mean
Mean is the most commonly used central tendency measure. It has further three types. We have explained these three types of mean.
Arithmetic Mean
The arithmetic mean is simply the average of the data. We can easily obtain the arithmetic mean by dividing the sum of the values by the total number of the values. To donate arithmetic mean, we use the symbol ‘X̄’. Here is the formula to find the arithmetic mean.
X̄ = X1+X2+…+Xn/n
X̄ = ΣX/n
Example of Arithmetic Mean
Find the arithmetic mean of the data 4, 10, 22 and 32.
A.M = 4+10+22+32/4.
= 68/4
A.M = 17
Weighted Arithmetic Mean
Sometimes, we have to deal with data sets where all the values don’t have equal importance. We have to provide certain numerical values to these data sets for relative importance. These numerical values are weights. If X1, X2, ……, Xn are values and their weights are W1, W2,….., Wn, we can find the weighted mean by using the following formula.
X̄w = W1X1+ W2X2+…+ WnXn/ΣW
X̄w = ΣWX/ ΣW
Example of Weighted Mean
If a student obtains marks 78, 98 and 96 out of 100 in English, Physics and Chemistry and weights for these subjects are 2, 3 and 4 respectively, find its weighted mean.
| Marks | 78 | 98 | 100 |
| Weights | 2 | 3 | 4 |
X̄w = 78×2+98×3+96×4/9
X̄w = 156+294+384/9.
= 834/9
X̄w = 92.67
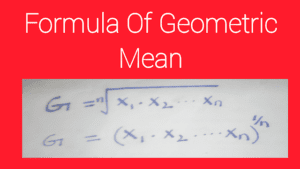
Geometric Mean
We denote the Geometric Mean by ‘G’. If we want to find the geometric mean of a set of n positive values X1, X2, ……, Xn, first of all, we have to find their product. After that, we have to take the nth root of their product. Here is the formula to find the Geometric Mean of the data.
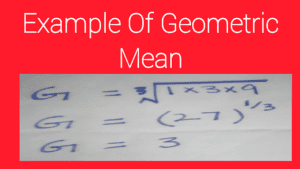
Example of Geometric Mean
Find the geometric mean of the set of the numbers 1,3 and 9.
Harmonic Mean
We donate Harmonic Mean by ‘H’. To find the harmonic mean of a set of n positive values X1, X2, ……, Xn, we have to find the mean of the reciprocal of the values. Here is the formula to find the harmonic mean of the data.

Example of Harmonic Mean
Find the harmonic mean of the values 7, 9, 11 and 12.

What is the Median?
The median is a value in the data set which separates the higher half from the lower half. Therefore, the middle value in a data set is the median. The most important benefit of the median is that it provides us a better idea of the typical value. For example, if you want to get an idea about household income, you can get its value in two ways. First, you can find it by mean but the problem with the mean is that it can either provide the lowest value or the highest value. The second way is to find it by the median. The Median provides us middle value. Therefore, it is the best way to find the typical value of a data set.
Steps to Find Median
Based on the total number of values in a data set, we use two formulas to find the median of the data set.
Finding the Median of the Odd Number of Values
To find the median of the odd number of values, you should follow the following steps.
i. You should arrange the values in ascending order.
ii. You should separate the half values from the left side and half values from the right side. For example, if you have 7 values, you should separate three values from the left side and three values from the right side.
ii. The middle value will be the median of the data set.
Example to Find Median of the Odd Number of Values
Find the median of the data set 2, 3, 9, 7, 0, 6 and 5.
First of all, we should arrange the values in ascending order.
0, 2, 3, 5, 6, 7, 9.
As the total number of values is 7. Therefore, we should separate three values from the right side and three values from the left side.
0, 2, 3, 5, 6, 7, 9.
Here, ‘5’ is the middle value. Therefore, ‘5’ is the median of the data set.
Finding the Median of the Even Number of Values
To find the median of the even number of values, you should follow the following steps.
i. Like the odd values, you should arrange the values in the ascending order.
ii. You should separate the half values from the left side and half values from the right side by leaving two values in the middle.
iii. By taking the mean of the two middle values, we can get the median of the data set.
Example to Find Median of the Even Number of Values
Find the median of the data set 2, 7, 8, 9, 5, 0, 7 and 3.
We have to arrange the values in ascending order.
0, 2, 3, 5, 7, 7, 8, 9.
There are eight values in this data set. Therefore, we should separate three values from the right side and three values from the left side.
0, 2, 3, 5, 7, 7, 8, 9.
5 and 7 are in the middle. So, by taking the mean of these two values, we get ‘6’. Therefore, ‘6’ is the median of this data set.
What is Mode?
In a data set, the value that appears more often is the mode. Like mean and median, the mode is also an essential way to express some specific information about a data set.
Rules to Find the Mode of a Data Set
Like mean and median, there are also some rules to find the mode of the data. Here are the rules to find the mode of a data set.
i. First of all, you should arrange the values in a data set in ascending order.
ii. If one value is appearing more often in the data set, this value is the mode of the data set.
iii. If more than one value are appearing more often in the data set, these values are the mode of the data set. It means that a data set can also have more than one mode.
iv. In some cases, the data set may not repeat any value. If no value is repeating in the data set, this data set doesn’t have a mode.
Examples to Find the Mode of the Data Set
Example 1
Find the Mode of the data set 2, 3, 4, 2, 6, 7, 8, 2 and 0.
0, 2, 2, 2, 3, 4, 6, 7, 8.
As ‘2’ is repeated more often three times. Therefore, ‘2’ is the mode of this data set.
Example 2
Find the Mode of the Data Set 2, 3, 4, 2, 3, 8, 9, 0 and 6.
0, 2, 2, 3, 3, 4, 6, 8, 9.
As ‘2’ and ‘3’ are repeated two times. Therefore ‘2’ and ‘3’ are the modes of the data set.
Example 3
Find the Mode of the Data Set 1, 42, 26, 39, 10, 5, 6, 7 and 8.
1, 2, 5, 7, 8, 10, 26, 39, 42.
As no value is repeated for more than one time. Therefore, there is no mode of this data set.
What is Range?
The difference between the largest and the smallest values in a data set is its range. The range of a data set provides us specific values about the data set because we have to subtract the smallest value from the largest value.
Steps to Find the Range of a Data Set
To find out the range of a data set, you should follow the following steps.
i. First of all, you should arrange the values of the data set in ascending order.
ii. Secondly, you should mark the smallest value in the data set.
iii. Thirdly, you should make the largest value in the data set.
iv. At last, you should subtract the smallest value from the largest value.
v. The result of this subtraction is the range of the data set.
Example to Find Range of the Data Set
Find the range of the data set 32, 22, 38, 40, 50 and 12.
12, 22, 32, 38, 40, 50.
Smallest value = 12
Largest value = 50
Range = Largest value – The smallest value.
= 50 – 12
Range = 38
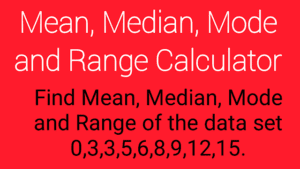
Example to Find Mean, Median, Mode and Range of the Data Set
Find the Mean, Median, Mode, and Range of the data set 3, 8, 9, 5, 12, 15, 6, 0, 3. To find these central tendency measures, we have to arrange the values in ascending order.
0, 3, 3, 5, 6, 8, 9, 12, 15.
Mean
X̄ = ΣX/n
X̄ = 0+3+3+5+6+8+9+12+15/9.
= 61/9
X̄ = 6.78
Median
0, 3, 3, 5, 6, 8, 9, 12, 15.
Median = 6
Mode
0, 3, 3, 5, 6, 8, 9, 12, 15.
As ‘3’ is repeated more often. Therefore, ‘3’ is the median of the data set.
Mode = 3
Range
Smallest value = 0
Largest value = 15
Range = 15 – 0
Range = 15.


1 thought on “Mean, Median, Mode and Range Calculator”